A "Food Desert" is an area, typically low-income, where residents have limited access to affordable and nutritious food, particularly fresh produce and healthy options. This lack of access can lead to poor diets and related health problems.
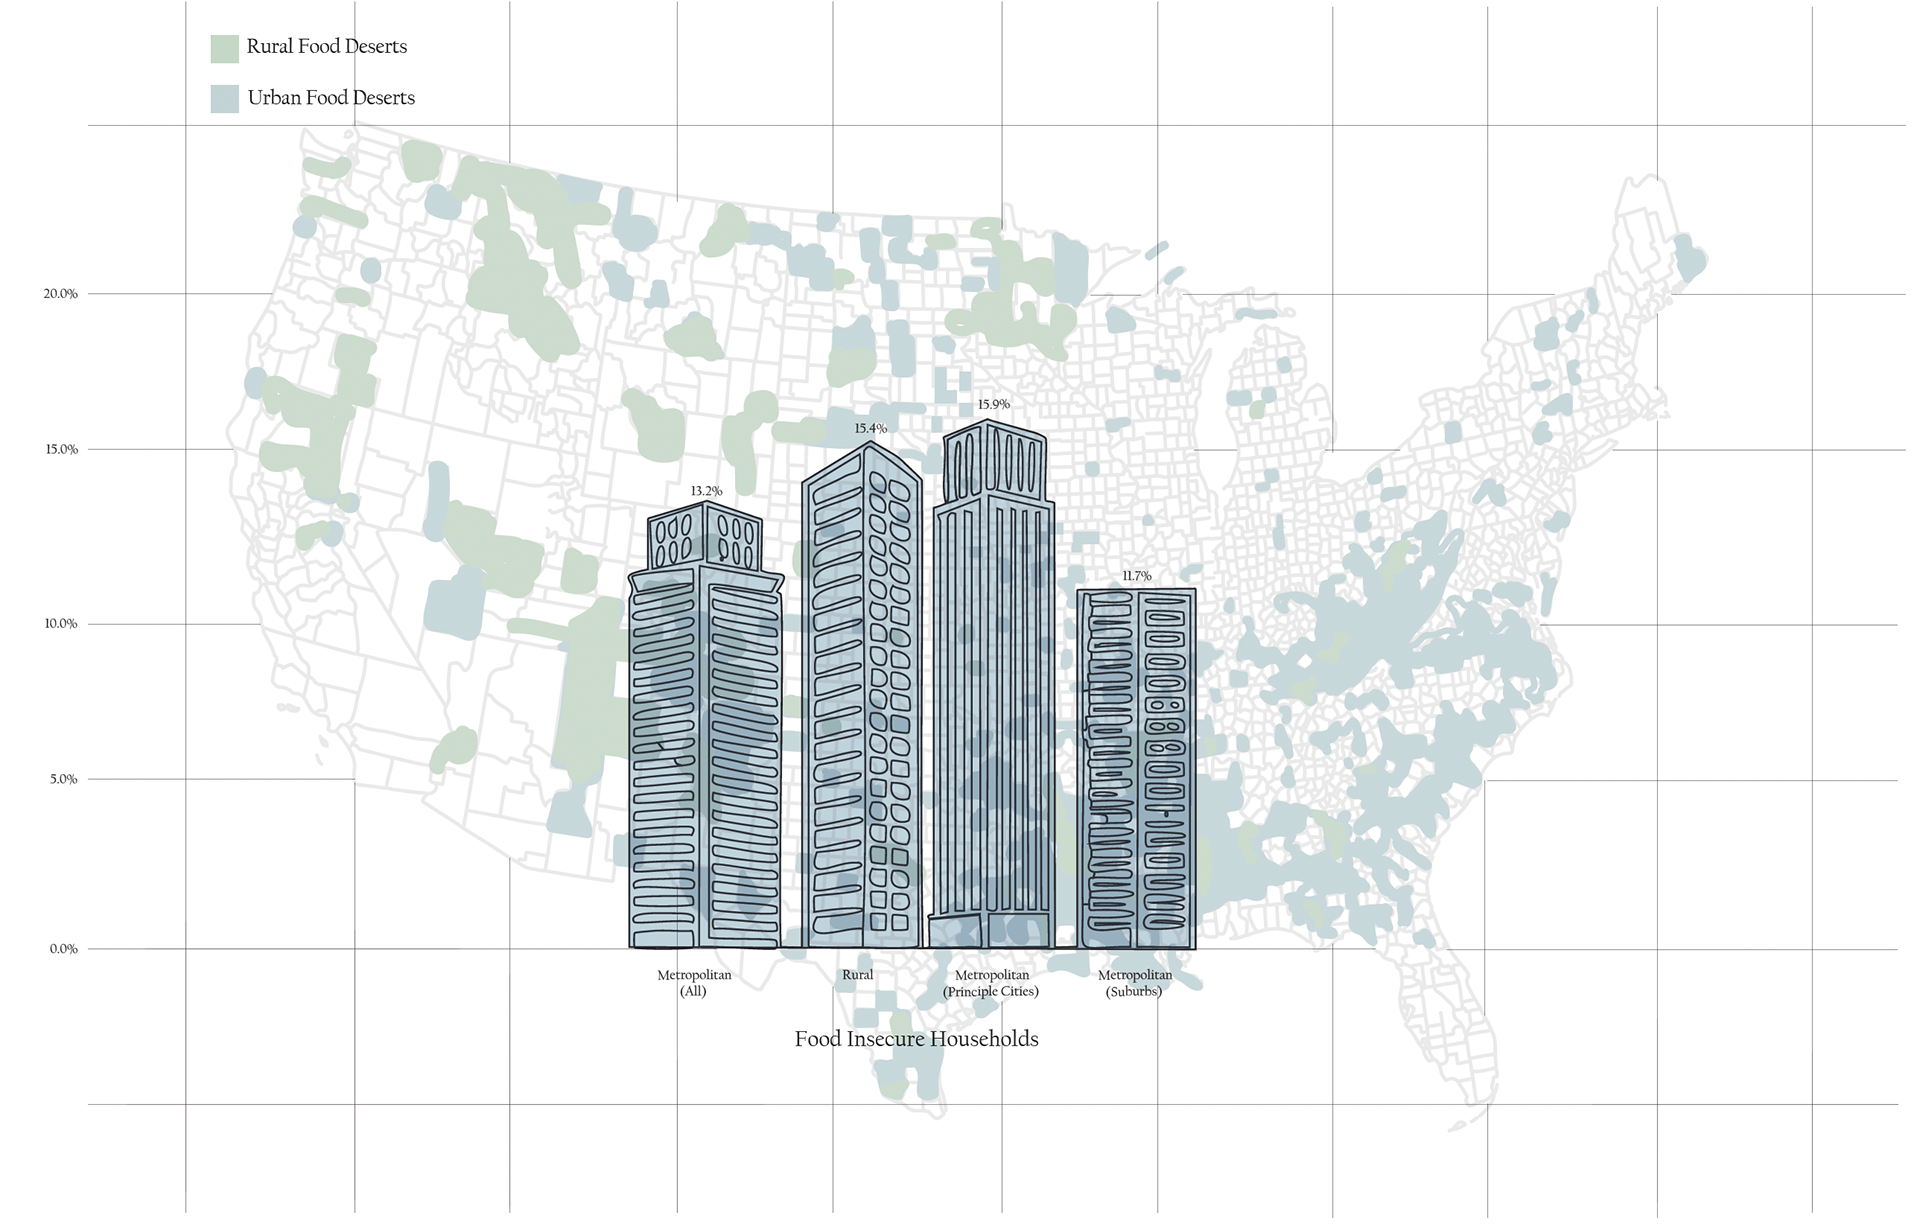
This infographic represents food deserts across America. The map highlights key areas within the country that experience food deserts, and the bar graph in the foreground demonstrates the amount of households in rural and metropolitan areas that experience food insecurity. The skyscrapers act as the bars in the chart to show that people who live in small towns are not the only ones who can be food insecure and live in a possible food desert. Many people who live within cities also have a difficult time gaining access to fresh nutritious food.
In the United States alone, there are over 6,500 food deserts scattered across the country, mostly in run-down and impoverished neighborhoods, affecting 13.5 million households. More than 53 million or 17% of Americans are considered low-income and have little to no access to supermarkets or similar large food stores, according to the US Department of Agriculture. More than 33% of residents in the United States must travel inconvenient distances to reach the nearest supermarket or grocery store; at least 1 mile in urban areas and 10 miles in rural areas.
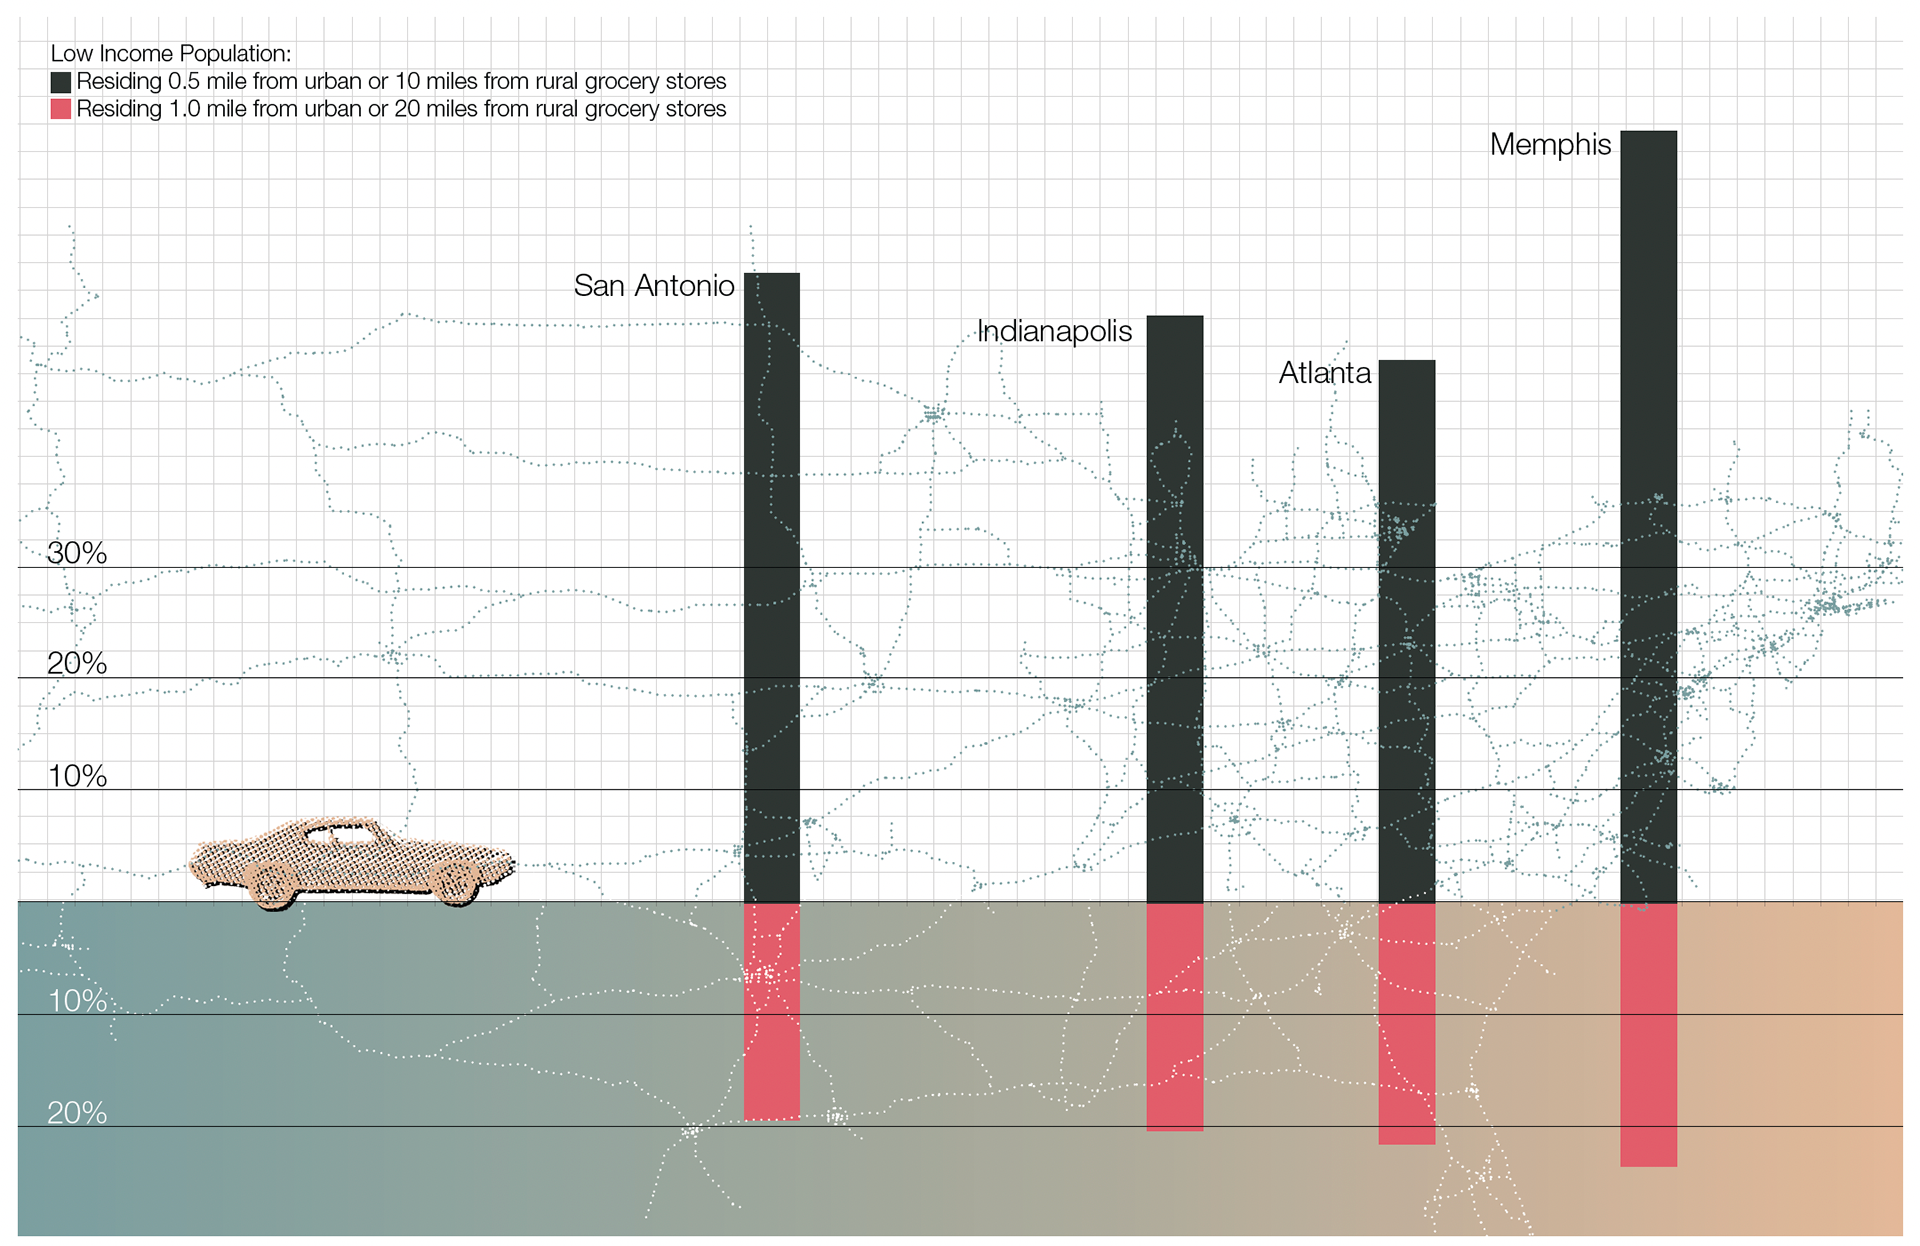
Food Deserts in USA. This infographic map presents food deserts in metro-urban areas. Charting low-income populations ranging from those living 0.5 miles from urban grocery stores, or 10 miles from rural grocery stores in black. While charting low-income populations ranging from those living 1 mile from urban grocery stores, or at least 20 miles from rural grocery stores in red. Input data adopted from USAFacts.
The lack of accessible supermarkets or food shops in certain locations impairs inhabitants’ ability to maintain a healthy and balanced diet, albeit awareness of healthy eating is another barrier as well. Localizing healthy food and enabling accessibility should be married to innovative solutions that foster dialogue and awareness within the domain of public health.
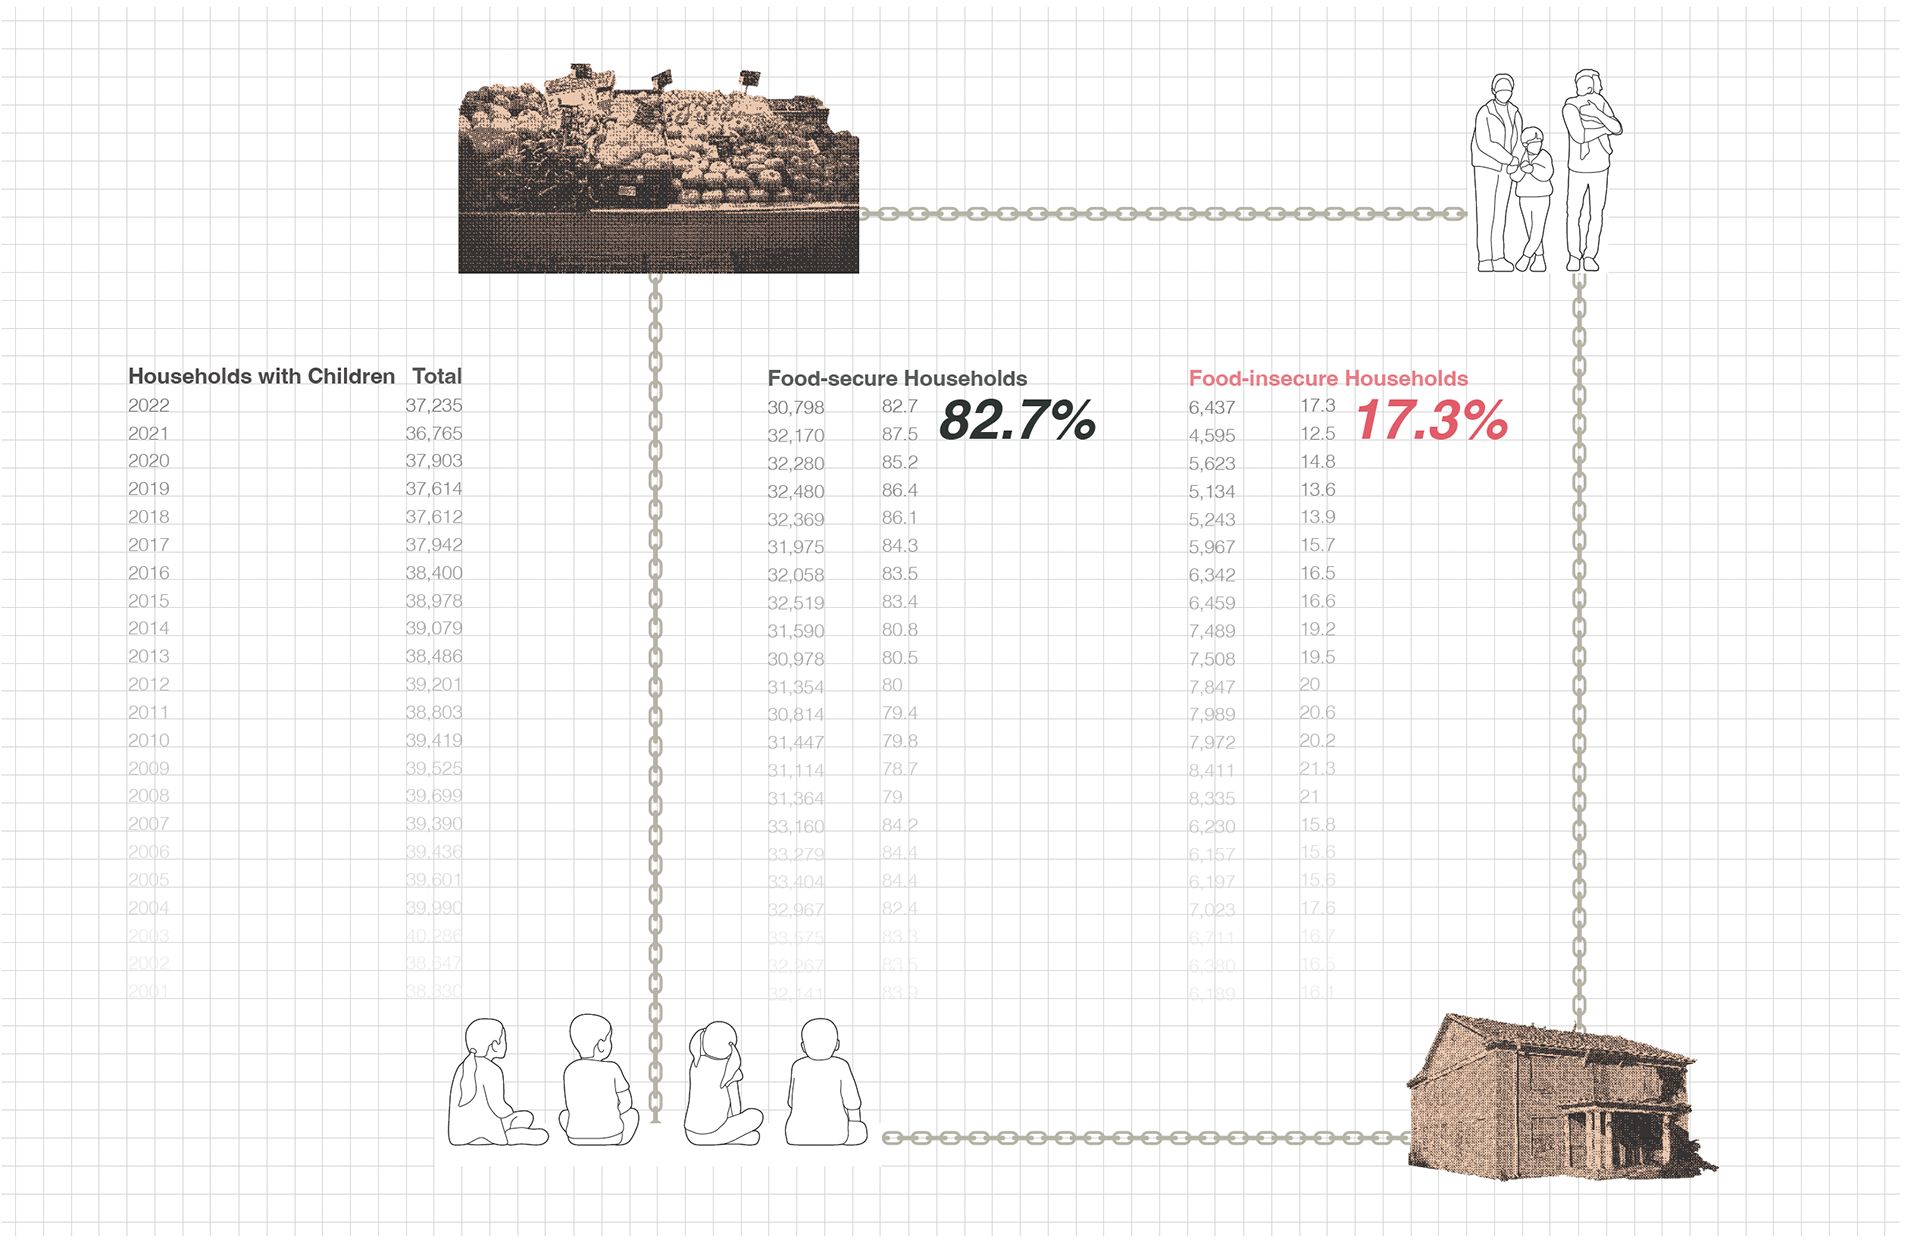
This diagram showcases the food security and insecurity of U.S. households with children. The diagram focuses on the most recent data of 2022 but contains data through 2001.
While collaging images and linework to represent the information, this infographic starts developing a link between events related to U.S. households with children by food sequrity and insecurity.
While collaging images and linework to represent the information, this infographic starts developing a link between events related to U.S. households with children by food sequrity and insecurity.